Elevated Web exception rate
Postmortem
On Tuesday March 8th, 2016, between 20:11 and 22:32 UTC, for a little over 2 hours, you may have encountered errors while using the Datadog application. This was a particularly painful outage which affected a narrow but very visible part of our service. We are sorry for the frustration we caused that day.
With this postmortem we would like provide you with a detailed explanation of what happened and the lessons we learned on the way.
The symptoms: slow web navigation, intermittent errors
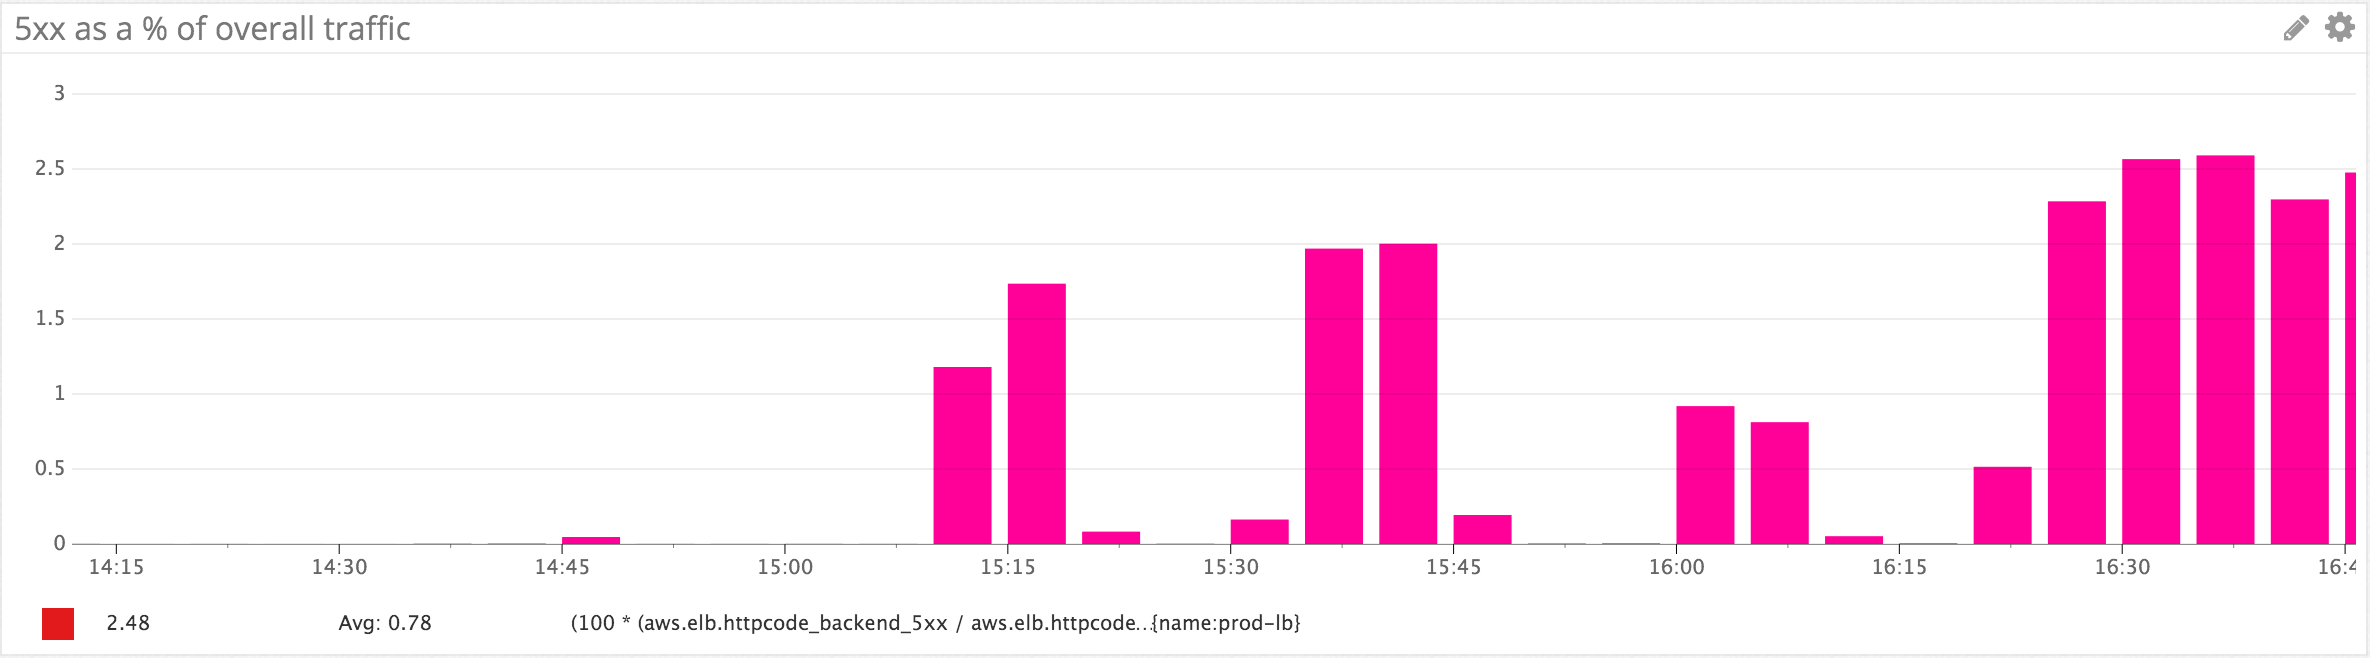
At 20:11 UTC our internal alerting system reported a very sudden jump in 5xx responses returned by our web application. All other major components (e.g. data intake, monitors and alerts) were not affected; in other words we were receiving and processing data but had difficulties presenting the results back reliably.
The overall error rate (5xx HTTP calls/overall HTTP calls to the web application only) jumped markedly at the time of the outage starting at 20:11 UTC (15:11 EST on the graph).
The stage: session management
With every single web request coming to our application comes a cookie that identifies the request as being part of an existing session so that you don’t have to log in again at each request. This cookie contains a session identifier that resides in a cluster of Redis instances.
It was that session cluster that failed during the outage. It failed in a novel way, one we had not anticipated: all requests completed but a number of them took much longer than expected, causing timeouts in calling code downstream. Timeouts rippled through the web code ultimately turning into HTTP 5xx errors as load balancers decided they could not wait for responses any longer.
The cause: network brownouts
From 5xx to TCP retransmits
Here’s a zoom on the first 2 error spikes as seen from the HAProxy load balancers (time zone is EST) as measured by the haproxy.backend.response.5xx metric in Datadog. Given that HAProxy gets involved very early on in the routing of the request to the web application, this metric closely represents the HTTP 5xx our customers experienced.
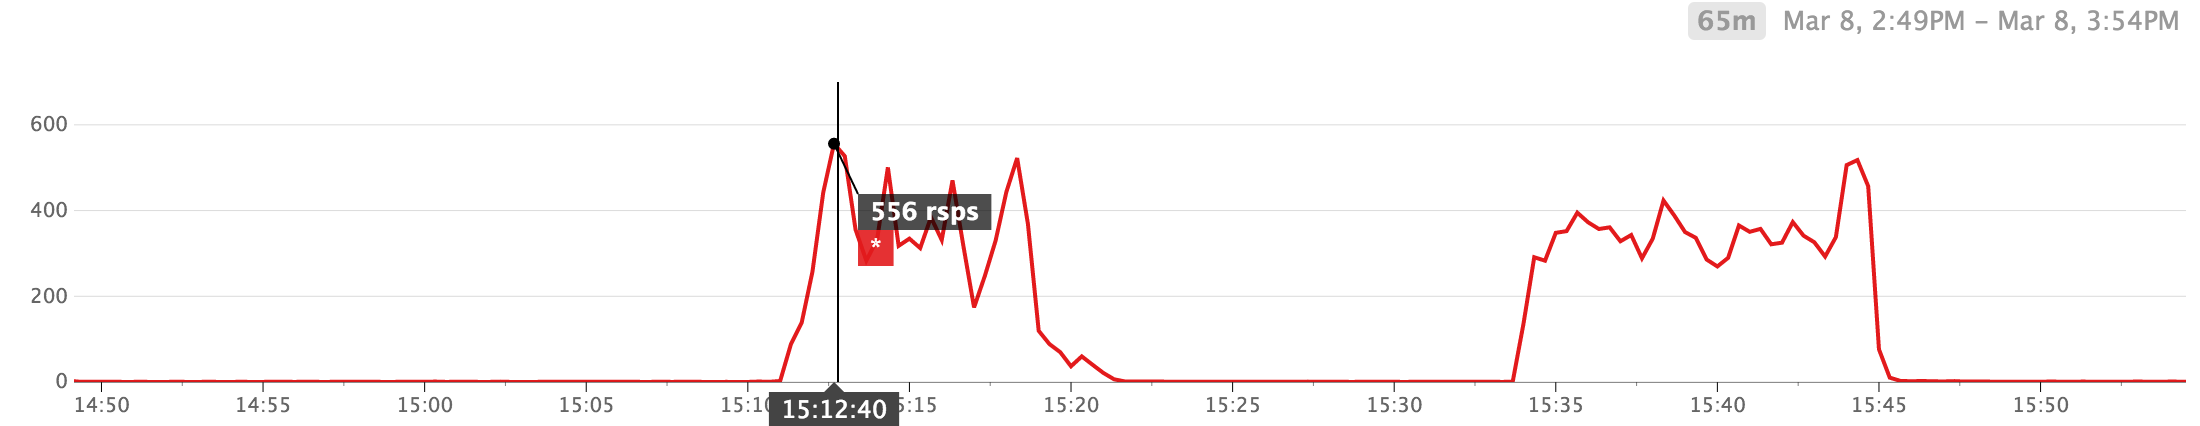
And here’s a graph of the number of retransmitted TCP segments from one of the Redis instances that act as session stores, at the same time (measured by system.net.retrans_segs in Datadog). Notice the strong correlation between the number of HTTP 5xx and TCP retransmits.
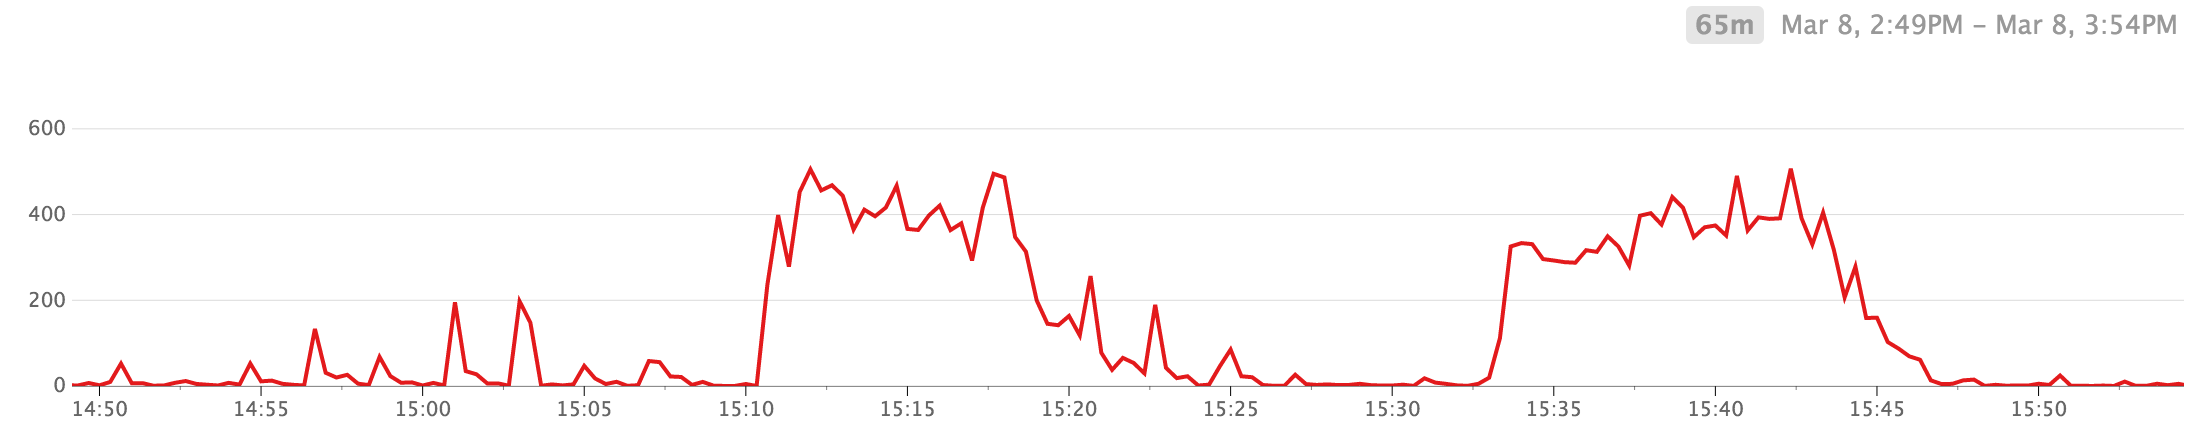
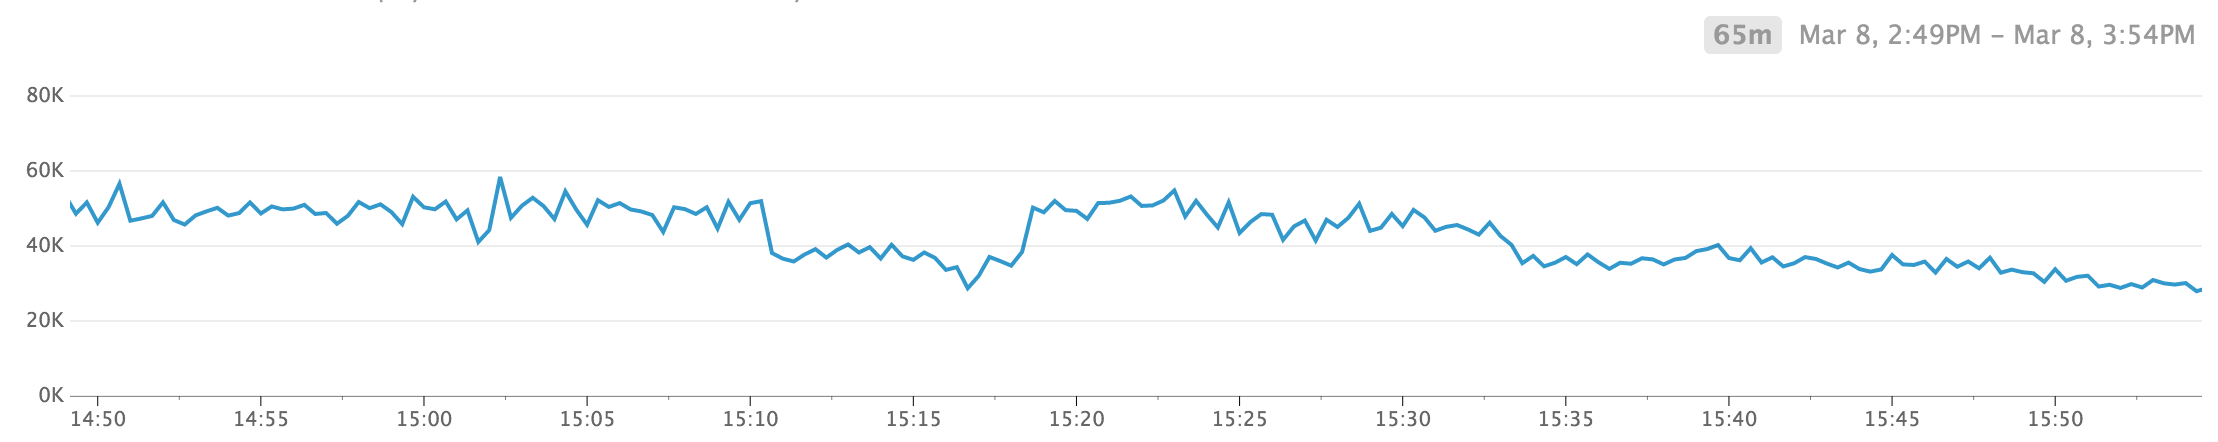
To put things in perspective, the number of TCP retransmits never went over 1.5% of the count of outbound packets but it caused the cluster's network throughput (as measured by system.net.packets_out.count) to drop by 25% in a matter of seconds.
What’s a TCP retransmit?
TCP uses among other things, sequence numbers and acknowledgements in order to implement reliable delivery and congestion control. Upon sending a packet, Linux will place it in a queue so that it can be matched with the acknowledgement coming back from the (Redis) client (in this case, one of many web nodes).
What happens if the acknowledgement never shows up? TCP dictates that the packet be resent, which holds up the completion of the TCP connection (even with SACK turned on) until the resent packet gets acknowledged.
Given that the retransmit timeout will be greater than 200ms (and can easily be 1, 10 or 60s), this means that a Redis request/response could go from 20ms to 1s or more despite a relatively small number of acknowledgement packets actually lost.
Here’s an example of a longer retransmit timeout (1.632s) with 1 retransmission, shown by the command ss -i -t.
tcp    ESTAB      0      96  source->destination
       cubic wscale:7,7 rto:1632 rtt:4/2 mss:1448 cwnd:1 ssthresh:7 send 2.9Mbps unacked:1 retrans:1/4
Of interest is that we did not observe any lost packets during the whole outage: the system.net.packets_out.error kept flatlining at 0. To be more precise, Linux was not directly aware of any lost packets during the outage (this subtle distinction will matter later on).
The delays and added latency were enough to kill overall performance and trigger timeouts, because checking the validity of a session occurs at each request. When the session store sputtered, the application became frustrating to use.
Potential causes for TCP retransmits
We made a few hypotheses in sequence at the beginning of the outage:
- TCP retransmits could be caused by an issue in the network between Redis and the rest of the world.
- TCP retransmits could be caused by Linux’s internal network stack causing incoming packets to be dropped under load.
- TCP retransmits could be caused by the hypervisor dropping packets to enforce fair quality of service between the various virtual machines it hosts.
Ruling out external network issues
When running in a public cloud, network issues cannot be observed directly since none of the (software-defined) network statistics are available to the end user. Our first response is to consider that instance malfunctioning and to fail over to replicas, under the assumption that the network fault is localized to a physical node, a rack or a data center.
We failed the cluster over to its replica in a different data center shortly before 21:00 UTC (after the second spike) but the 3rd spike quickly assured us that we could rule out an external network issue. And the probability of a systemic but unreported issue affecting a large swath of the public cloud was too slim to be considered valid.
Turning our attention to the OS
Another thing we noticed at the time was the heavy CPU utilization in the cluster.
Incoming packets (such as the ones carrying acknowledgements that will prevent TCP retransmits) require CPU cycles to be handled. Specifically in Linux 3.13 (the version in use), there is provision to drop packets if socket kernel buffers (SKB) fill up. For details about the specific logic (called skb_flow_limit), you can refer to the source (if you are interested in learning how the network stack works in Linux, this series offers a great overview.
One way that SKB could fill up is a surge in incoming traffic such that the kernel can’t process traffic fast enough. The code mentioned above ruled that hypothesis out because of the return value of enqueue_to_backlog, which should have triggered lost packet counts to increase, if indeed skbflowlimit had come into play. And if you remember, lost packet counts flatlined at 0 throughout the whole episode.
So this hypothesis was ruled out too: Linux did not knowingly drop packets.
Packet loss between the hypervisor and the OS
Since we ruled out systemic network issues and the instance’s OS dropping packets on the floor, that left us with suspecting that the cluster hit limits enforced by the hypervising layer or the cloud provider’s software-defined network.
To validate this hypothesis we upsized the entire cluster to a class of instances with a purported higher networking throughput under the assumption that they would have higher limits. This action fixed the issue right away.
The road to resolution: an unneeded detour
In the process of failing over to faster nodes we wanted to preserve all sessions so that no one would be logged out. We decided to carry over existing sessions to the new cluster.
This was a mistake, obvious in hindsight. To carry over existing sessions, we had to copy them from the old cluster to the new cluster. Being in the cloud, we needed… the network to be reliable for the old cluster.
Initial attempts to replicate using Redis’ native replication failed because some packets would be retransmitted, causing the original nodes’ replica output buffer to burst under pressure. Too many changes were waiting to be sent over to the replica, stalled by a few TCP retransmits; Redis properly gave up rather than running out of memory.
More manual attempts to do the same were more successful but ultimately caused us to delay recovery by tens of minutes.
Lessons learned
From this we learned some lessons for the future.
- Network performance is probably the least quantified resource in public clouds (e.g. “moderate” and “high” as opposed to 64GB of RAM for memory) thus we are double-checking all our instance choices in light of this packet loss outage.
- In the midst of the outage we made the wrong decision and prolonged the agony in trying to avoid logging out everyone. A clean cut would have been better in this instance and we are working it into our outage decision trees.
In closing
Beyond the technical details, which I hope you found useful, I wanted to reiterate our apologies for the outage and the frustration we caused. We would like to hear your feedback.
Alexis Lê-Quôc, CTO